In the new design of the admin ui of keycloak we wanted to include a dashboard with some statitics, why, because dashboards are cool and they look nice 😊
 We could add even more gauges and graphs of course, but why not use something that is already there like Prometeus and Grafana.
Aerogear has a SPI that exposes a Pormetheus /metrics endpoint and a Grafana dashboard to go with it so let’s install that:
cd /tmp
wget https://github.com/aerogear/keycloak-metrics-spi/releases/download/2.5.3/keycloak-metrics-spi-2.5.3.jar
to install it copy it into keycloak I’m using the quarkus based version:
cp /tmp/keycloak-metrics-spi-2.5.3.jar /opt/keycloak/providers/
restart keycloak and enable the metrics-listener in the admin ui: “Realm settings” -> “Events”, select metrics-listener from the dropdown

All we have to do now is install Prometeus and tell it to consume this endpoint
curl -LO https://github.com/prometheus/prometheus/releases/download/v2.19.1/prometheus-2.19.1.linux-amd64.tar.gz
tar xvf prometheus-2.19.1.linux-amd64.tar.gz
cd prometheus-2.19.1.linux-amd64
Then edit the prometheus.yml to add the keycloak endpoint
23c23,24
<   - job_name: 'Prometheus'
---
>   - job_name: 'keycloak'
>     metrics_path: '/realms/master/metrics'
29c30
<     - targets: ['localhost:9090']
---
>     - targets: ['localhost:8080']
see the whole file and start it with ./prometheus
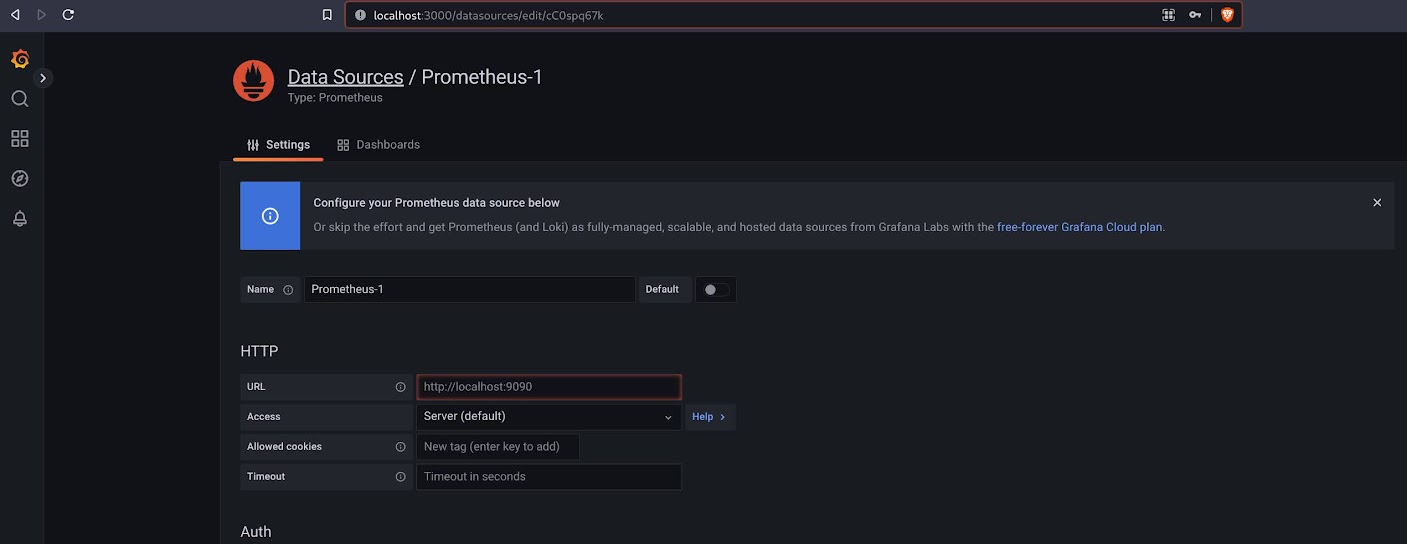
Install grafana and set it to use Prometheus as the data source:
wget https://dl.grafana.com/oss/release/grafana-9.0.2.linux-amd64.tar.gz
tar -zxvf grafana-9.0.2.linux-amd64.tar.gz
cd grafana-9.0.2
./bin/grafana-server
open http://localhost:3000/ and login with admin and admin set Prometheus as data source http://localhost:9090
then import the dashboard of the aerogear/keycloak-metrics-spi “Dashboard” -> “Browse” -> “Import” and enter the id: 10441
And there we have it this beautiful dashboard:
